2015年度10大Plotly数据可视化美图及工具介绍
文章整理出了2015年最优秀的十个Plotly图表,这些交互式的图表使用Plotly的web app和APIs制作而成。
第十位. “2001-2014对同性婚姻的支持”
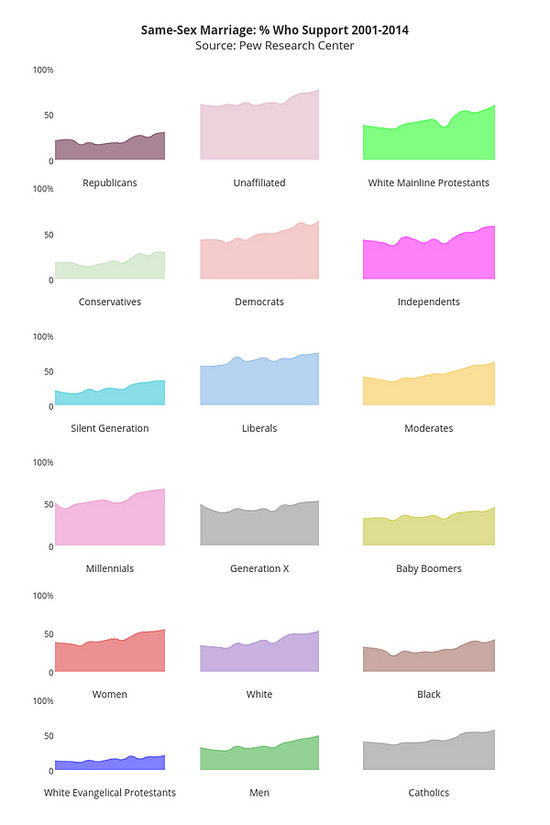
这些Tufte迷你图(sparklines)由Pew Research绘制。
制作这些图表运用了Python, R以及Plotly web app.
第九位. “在Facebook网络中的团体”
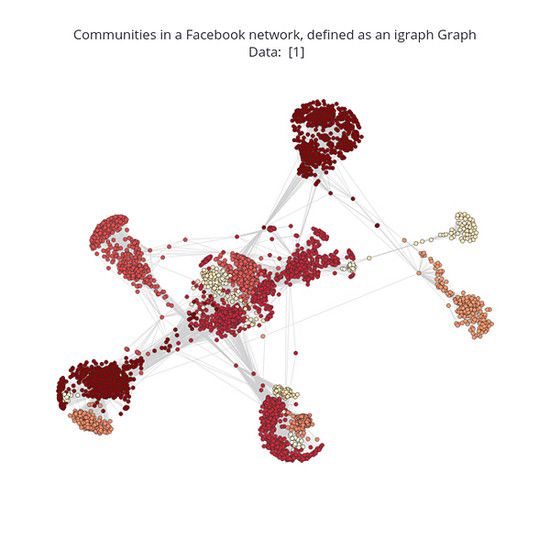
这个网络图(network graph)由一个用户名为empet的数学家和教授绘制。
学习如何用Plotly在IPython Notebooks中制作这种网络图(how to make this network graph), 你也可以运用R和MATLAB来实现。
第八位. “美国国债收益曲线”
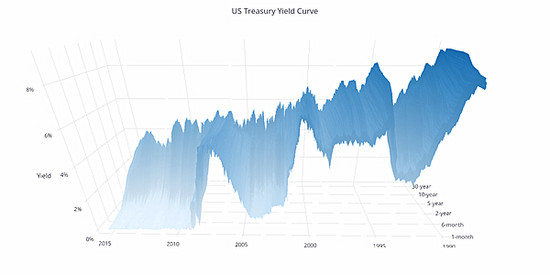
这个表面图(surface chart)由Plotly 的联合创始人chris绘制。
学习如何运用Plotly在Python里绘制这种3D曲线图(how to make this 3D surface chart ),你也可以在Plotly web app里用R或者Excel data实现。
第七位.“美国的水上游乐园”
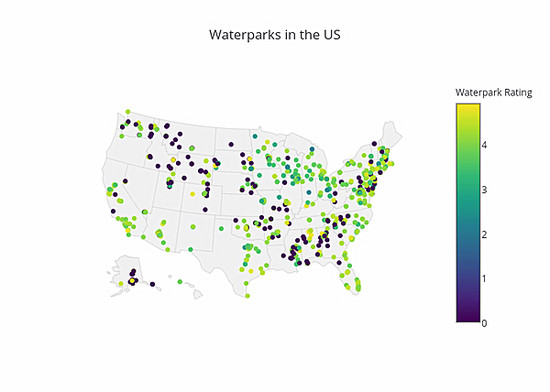
这个分级统计图(chloropleth map)由一个名为rozran00的博主绘制。
学习如何运用Plotly 在Python里绘制这种分级统计图(how to make this chloropleth map), 你也可以在Plotly web app里用R或者Excel data实现。
第六位. “聚类树状热点图”
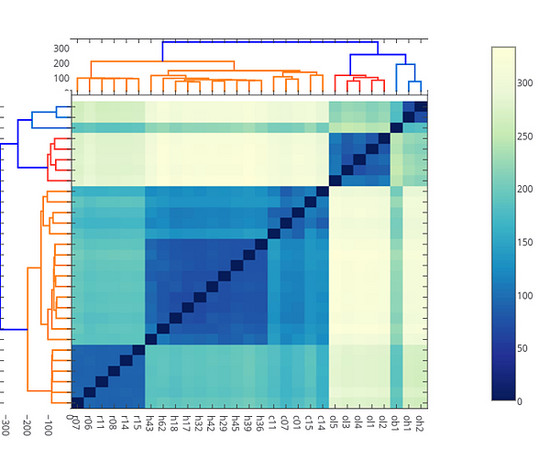
这个聚类树状热点图(dendrogram heatmap)由一位名叫oxana的生物学硕士生绘制。
学习如何运用Plotly 在Python里绘制这种聚类树状热点图(Learn how to make this dendrogram heatmap),你也可以使用ggplot2来实现。
第五位.“历史上绘画大师对色彩的选择”
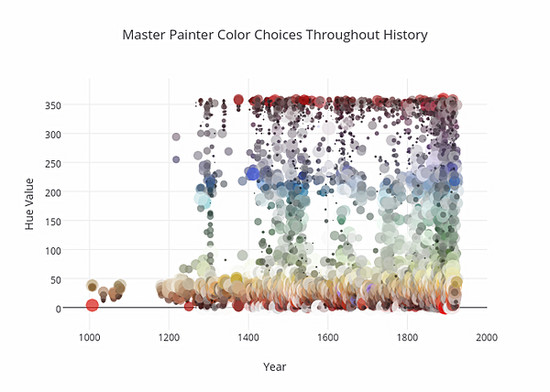
这个气泡图(bubble chart)由brandnewpeterson绘制。
学习如何运用Plotly 在Python里绘制这种气泡图(how to make this bubble chart),你也可以或者在Plotly web app里用R, Matlab 或者Excel data实现。
第四位. “元素周期表”
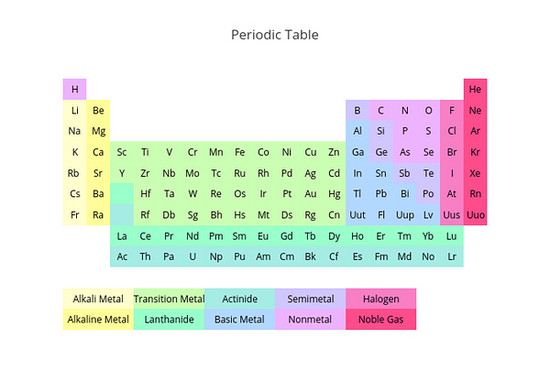
这个注释热图(annotated heatmap)由Plotly的软件工程师chelsea_lyn绘制。
学习如何运用Plotly 在Python里绘制这种注释热图(how to make this annotated heatmap) ,你也可以或者在Plotly web app里用R, Matlab 或者Excel data实现。
第三位. “合著科学家的合作网”
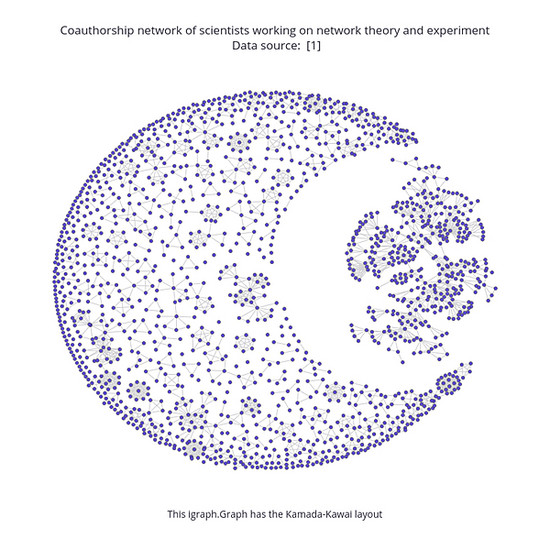
这个网络图由empet绘制。
学习如何运用Plotly 在IPython Notebooks里绘制网络图(how to make this network graph),你也可以用R和Matlab来实现。
第二位. “透气面”
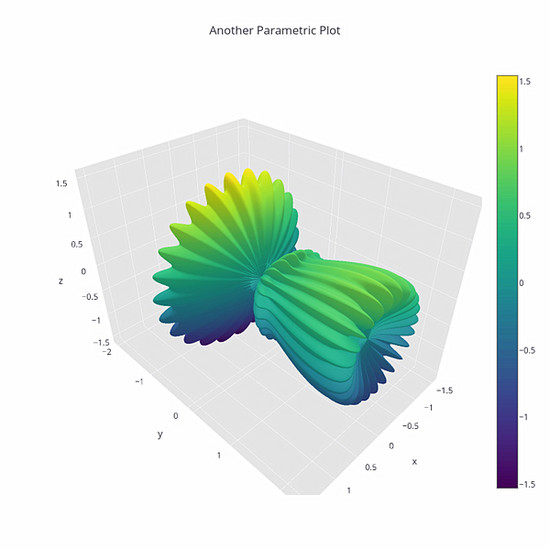
这个三维表面图(3D surface plot)由 数据 科学家 tarzzz绘制。
学习如何运用Plotly 在Python里绘制这种三维表面图(how to make this 3D surface plot) ,你也可以或者在Plotly web app里用R, Matlab 或者Excel data实现。
第一位. “城市间的客流”
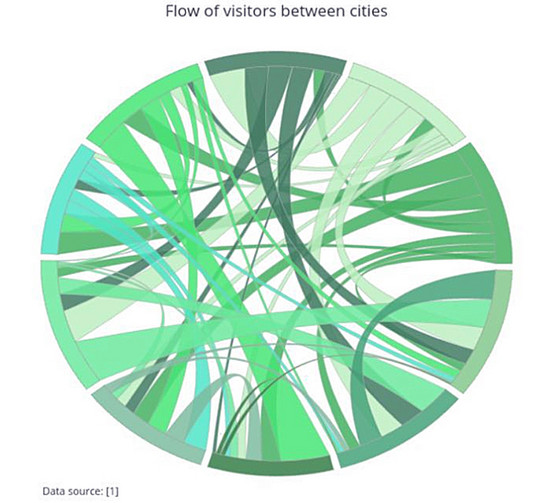
这个弦图(chord diagram)是empet在Python里绘制的。
学习如何用Plotly在Python中绘制这种弦图(how to make this chord diagram),下面是在R 或者Matlab中实现该操作 可视化 的编码。